GitHub
Hi, there! This section only highlights
only a few of my GitHub projects. You can view my complete GitHub profile
here.
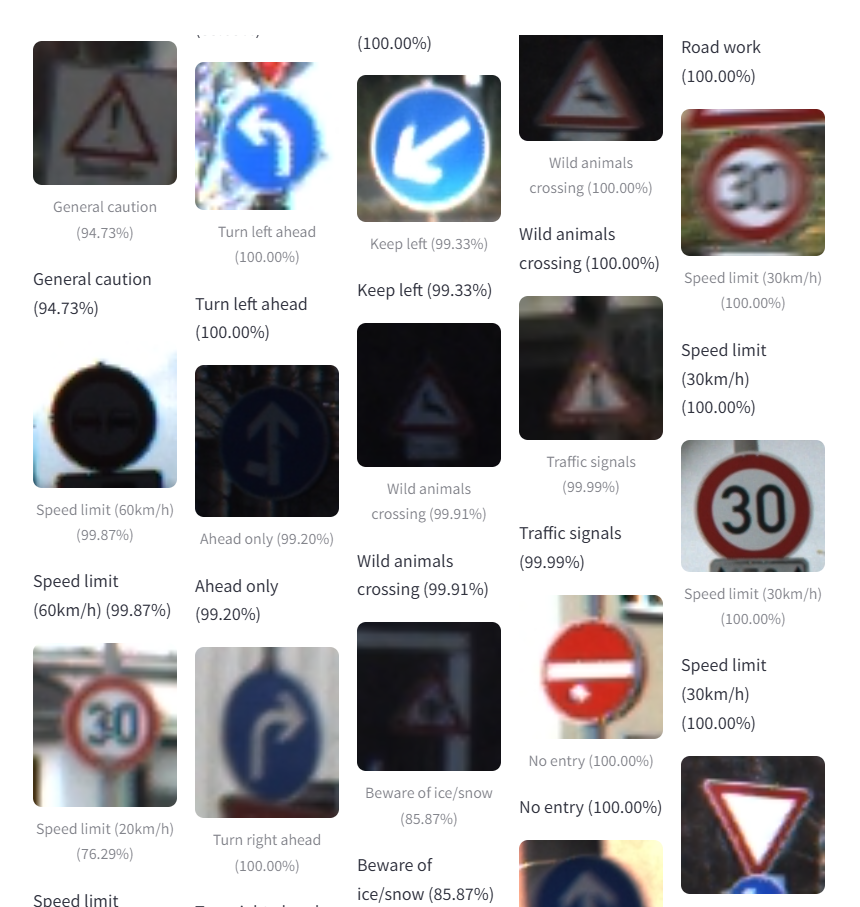
This project focuses on automated traffic sign recognition using a deep learning model trained on the GTSRB dataset. A Convolutional Neural Network (CNN) is implemented in PyTorch and deployed via a Streamlit web app, allowing users to upload and classify multiple traffic sign images at once. The system provides real-time predictions with confidence scores and displays results in a grid format for easy interpretation.
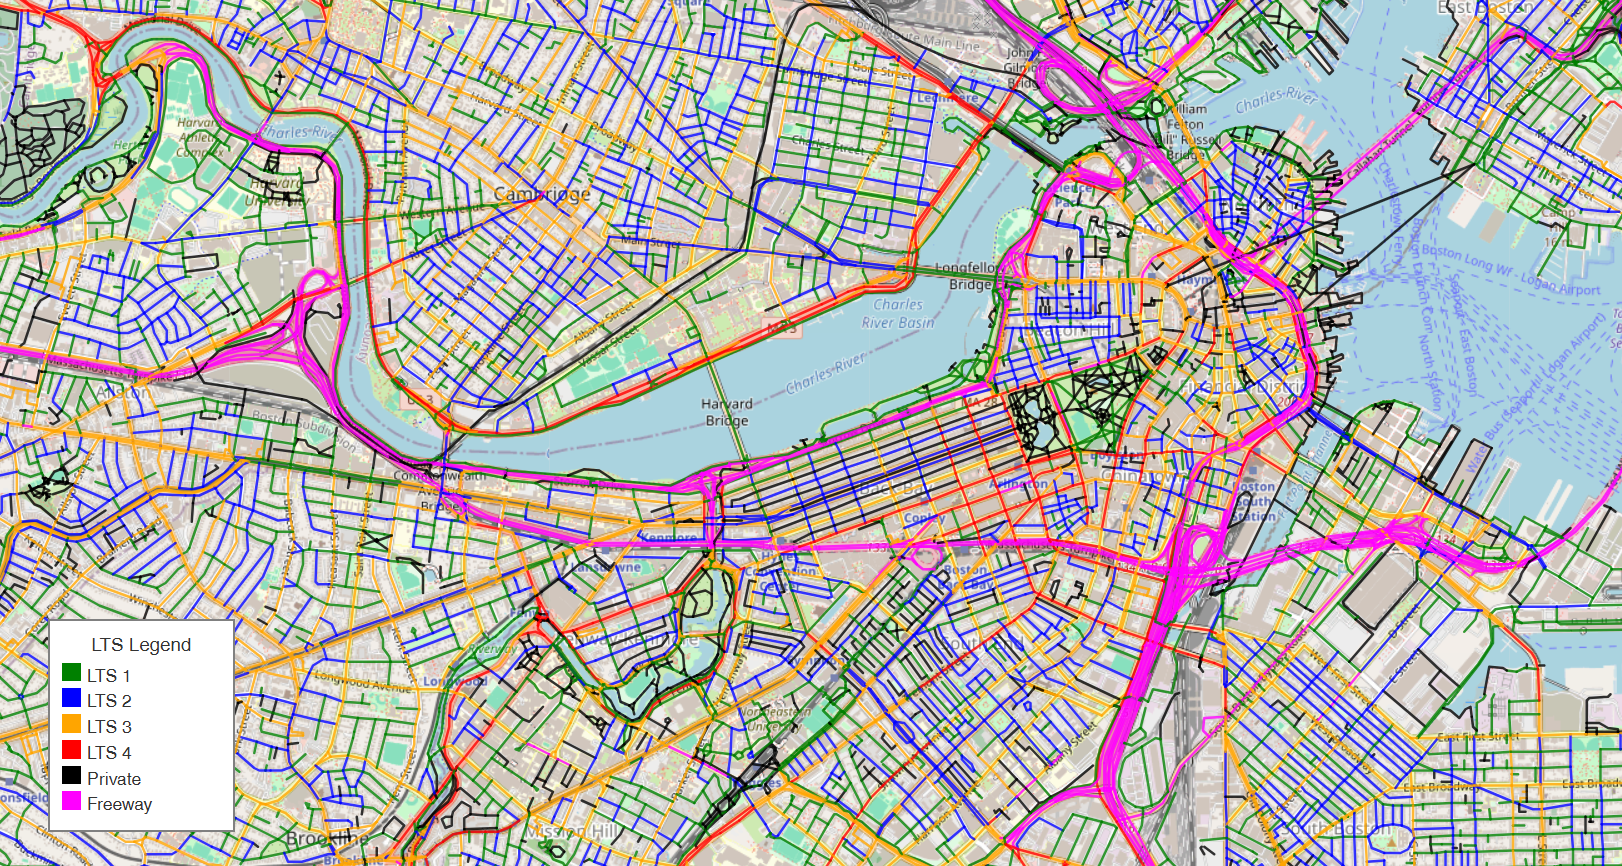
Bicycle Level of Traffic Stress (LTS) is a data-driven framework that objectively measures how comfortable a road feels for cyclists, with levels ranging from LTS 1 (low-stress, suitable for most cyclists) to LTS 4 (high-stress, requiring high confidence). Crossing Level of Traffic Stress (xLTS) evaluates the comfort and safety for cyclists at intersections or crossings, considering factors like volume and speed of the traffic being crossed, crossing distance, presence of a bike signal, crossing island, RRFB, etc., to rate the stress level Many cyclists feel anxious about crossing busy intersections, regardless of how comfortable the road segment is. By including xLTS, we can better understand the overall comfort level for cyclists, leading to more informed infrastructure decisions.
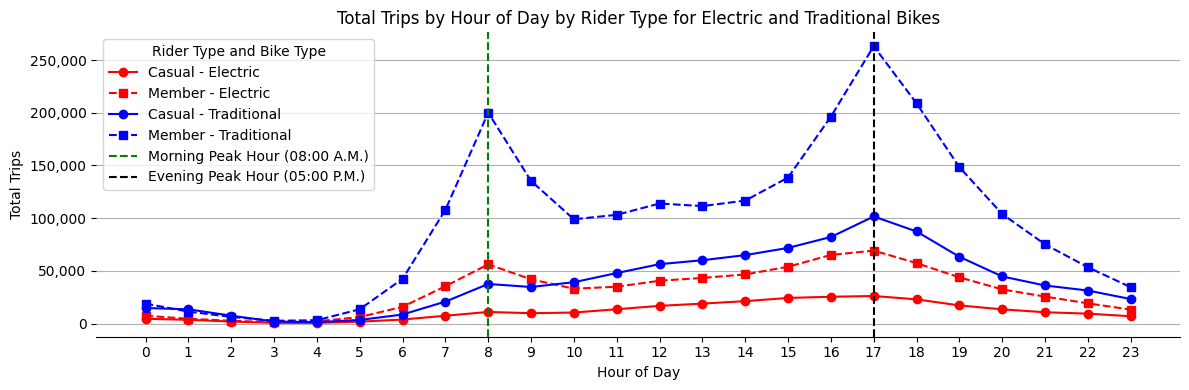
The introduction of electric bikes to Boston’s BlueBikes system has likely altered trip dynamics, including trip durations, demand patterns, and station usage. This analysis explores the impact of e-bikes on these factors, focusing on differences in trip lengths, popular routes, station turnover, and mode choice between electric and traditional bikes. By comparing e-bike trips with traditional bike trips, the goal is to understand how e-bikes influence overall system performance, user behavior, and mode preferences. These insights will help inform strategies for optimizing bike distribution and enhancing the efficiency of the bike-sharing system.
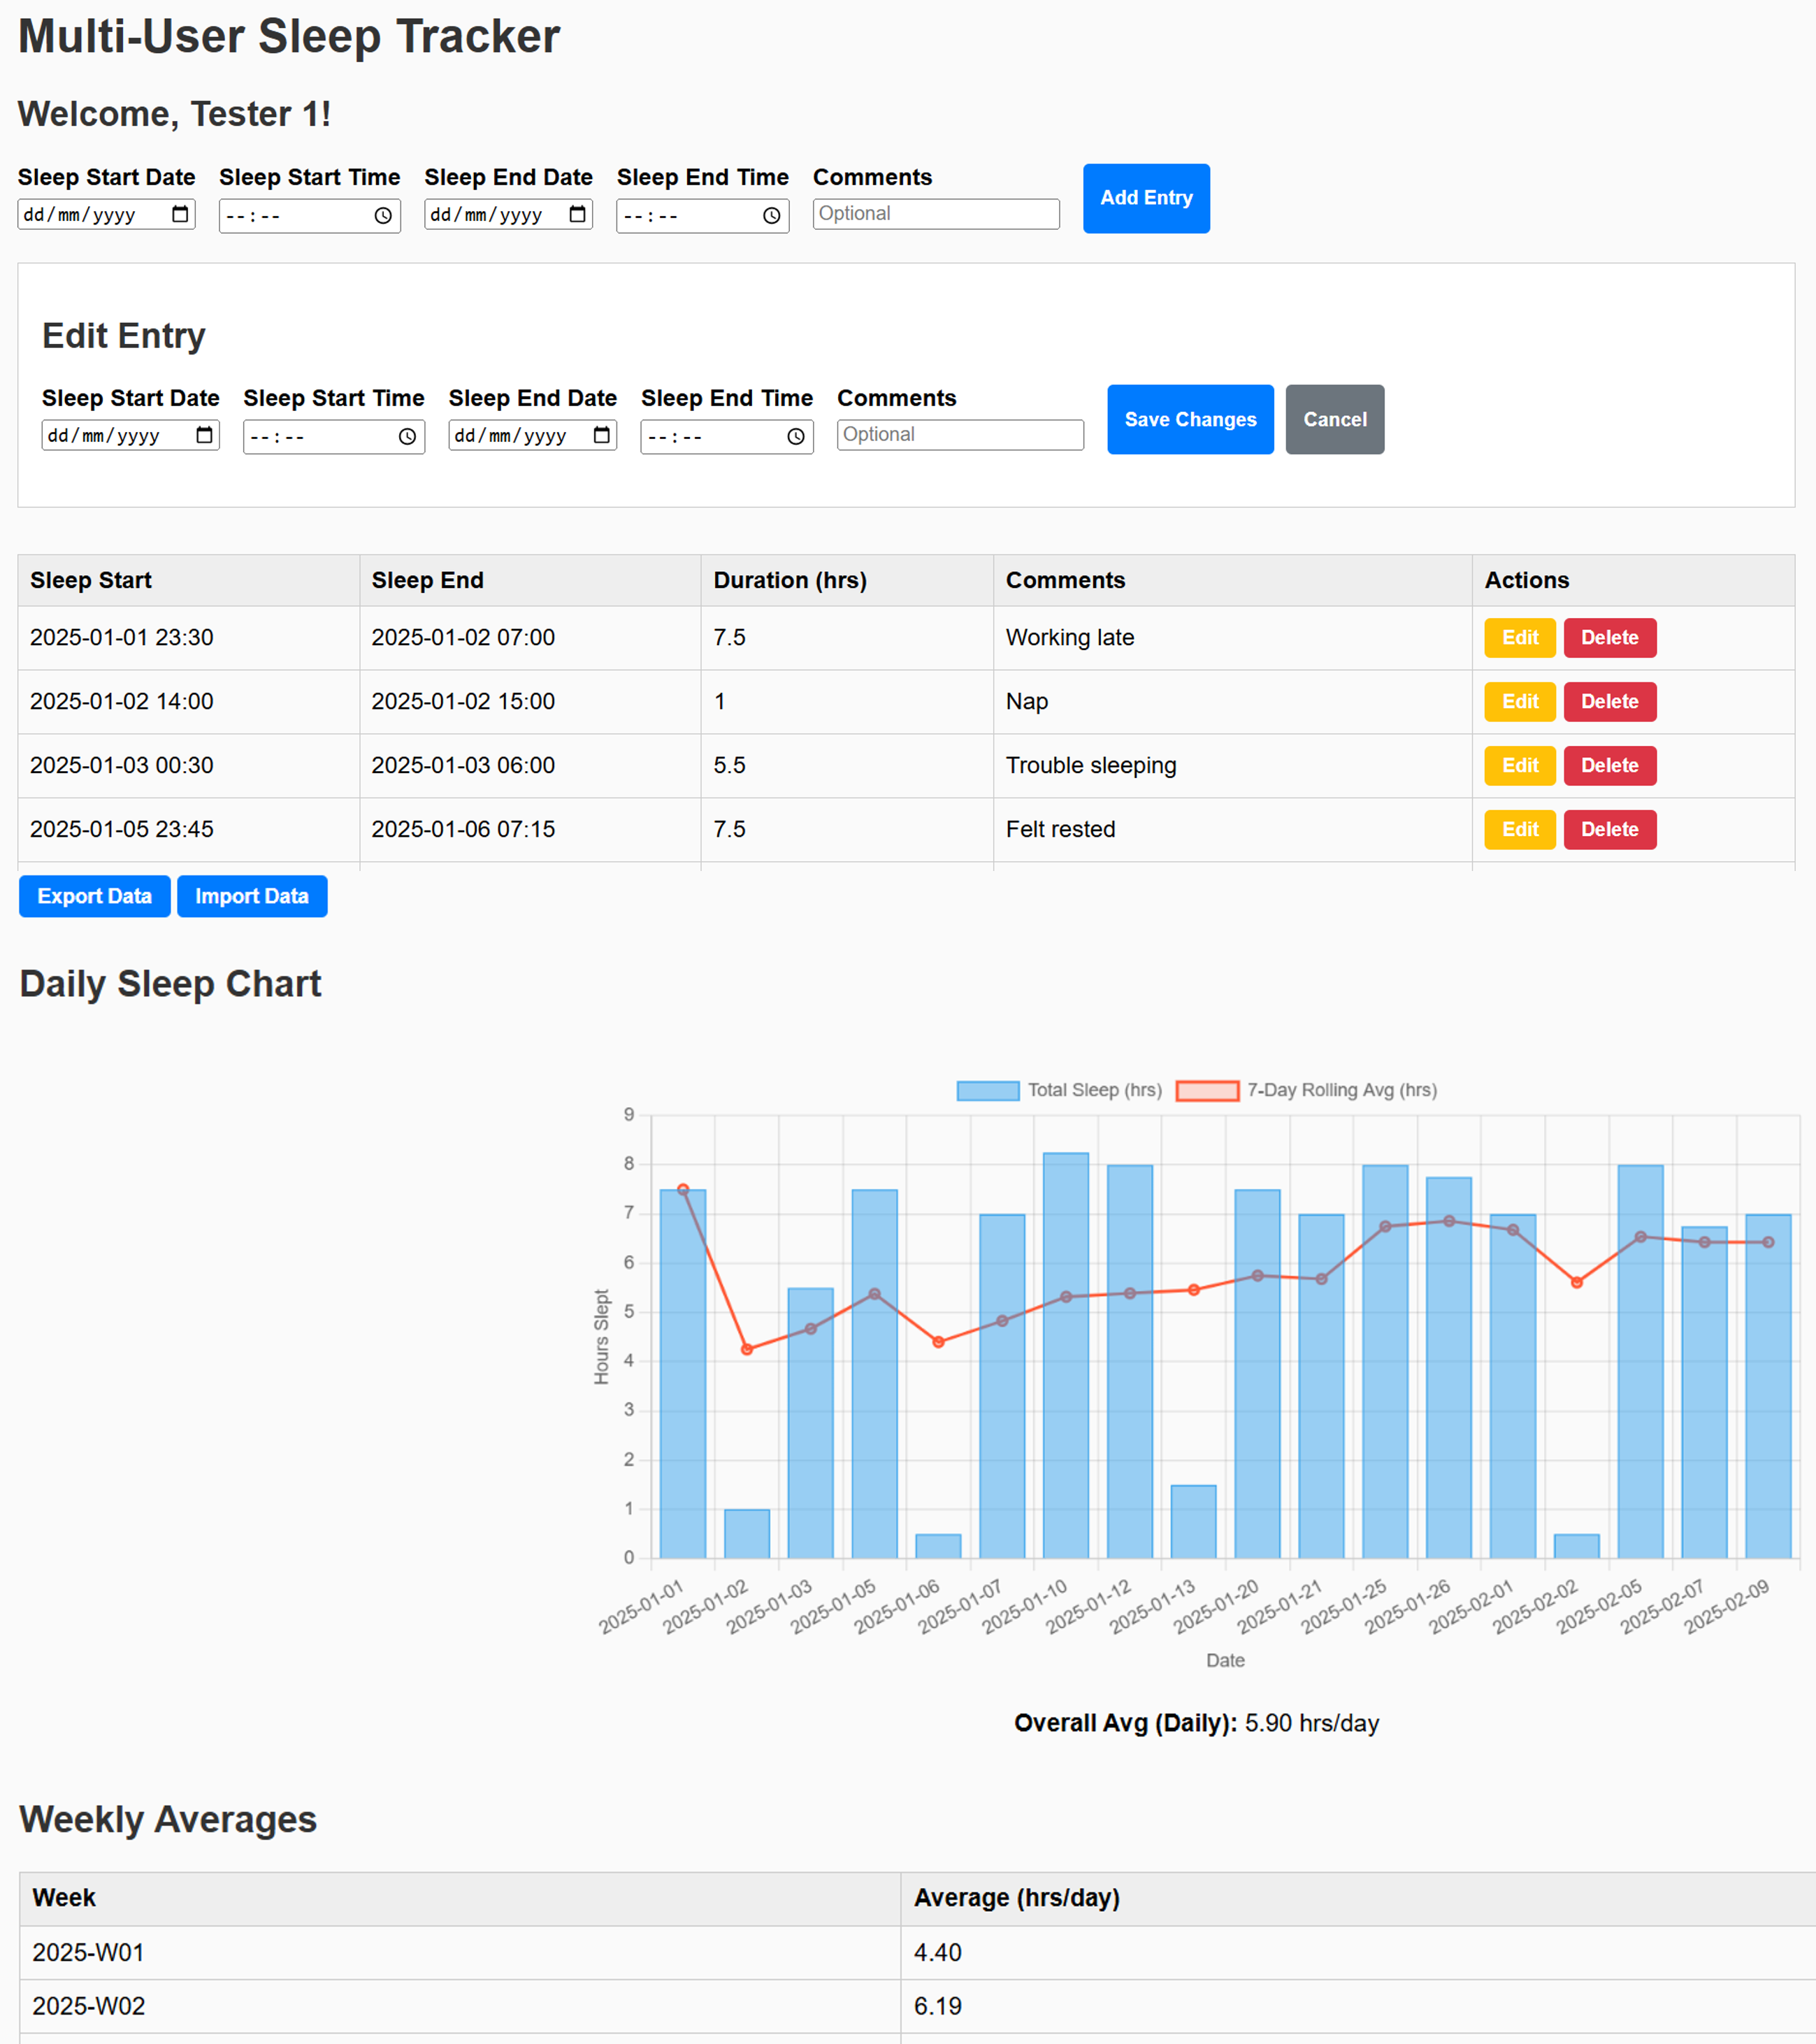
I created a multi-user web app that lets each user log in with a unique username and record their sleep sessions. All entries—start and end times, duration, and comments—are automatically saved in the browser’s Local Storage under that username. The app also generates a daily total sleep chart using Chart.js, providing an at-a-glance visualization of sleep patterns. Users can edit or delete existing records and export or import their data as JSON files, making it easy to back up or transfer. This simple, self-contained tool helps maintain ongoing sleep logs without needing a server or database.
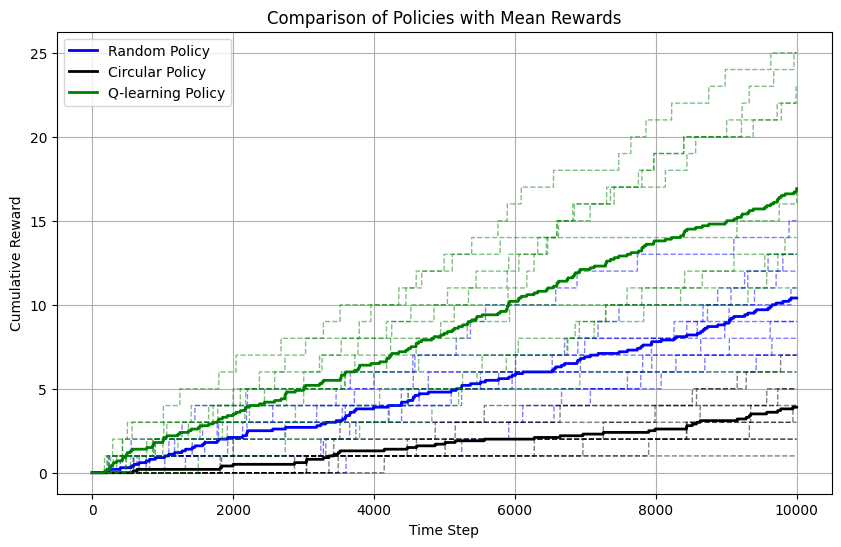
The Four-Room Reinforcement Learning (RL) problem is a classic grid-world environment where an agent navigates through four interconnected rooms, separated by narrow doorways. The agent must learn optimal policies to reach a goal state from any starting position, using actions like moving up, down, left, or right. The problem is designed to challenge exploration and learning efficiency, as the agent encounters varying rewards and obstacles, requiring it to balance exploration and exploitation while navigating through a structured, partitioned space.